
A Wilkinson power divider is a common three-port power splitter circuit that is used to split an input signal into two equal output signals, or to combine two signals into one. Unlike resistive or T-junction power dividers, a Wilkinson power divider allows for nearly complete isolation between the two ports and adds no resistive losses to the power split. Because of these characteristics, a Wilkinson divider is widely used in radio communication systems due to its ability to prevent crosstalk between channels — a phenomenon where one signal (or channel) affects the transmission of another signal (or channel). Here, we’ll look at how a Wilkinson divider can be simulated using COMSOL Multiphysics and the RF Module.

Modeling a Wilkinson Power Divider
A Wilkinson power divider splits an input signal into two equal outputs using two microstrip lines mounted on a dielectric substrate with a resistor mounted between the two output ports. The Wilkinson Power Divider model, available for download from the Model Gallery, demonstrates how such a divider can be accurately simulated.
The geometry of the Wilkinson Power Divider model contains a three-port device composed of a 50 Ω microstrip line and 70.7 Ω microstrip line, as well as a 100 Ω resistor between the ports. The relative dielectric constant, εr, of the 60 mil substrate is 3.38. In addition, the geometry includes the metal frame in which the divider is housed, four screws, and SMA connectors at each of the three ports. In COMSOL Multiphysics, these components can all be modeled using the Perfect Electric Conductor (PEC) boundary feature, and the 100 Ω resistor is modeled using a lumped element with a 100 Ω impedance. The figure below shows the symmetric electric field distribution across the top of the divider, demonstrating how the input energy is equally coupled to both of the output ports.
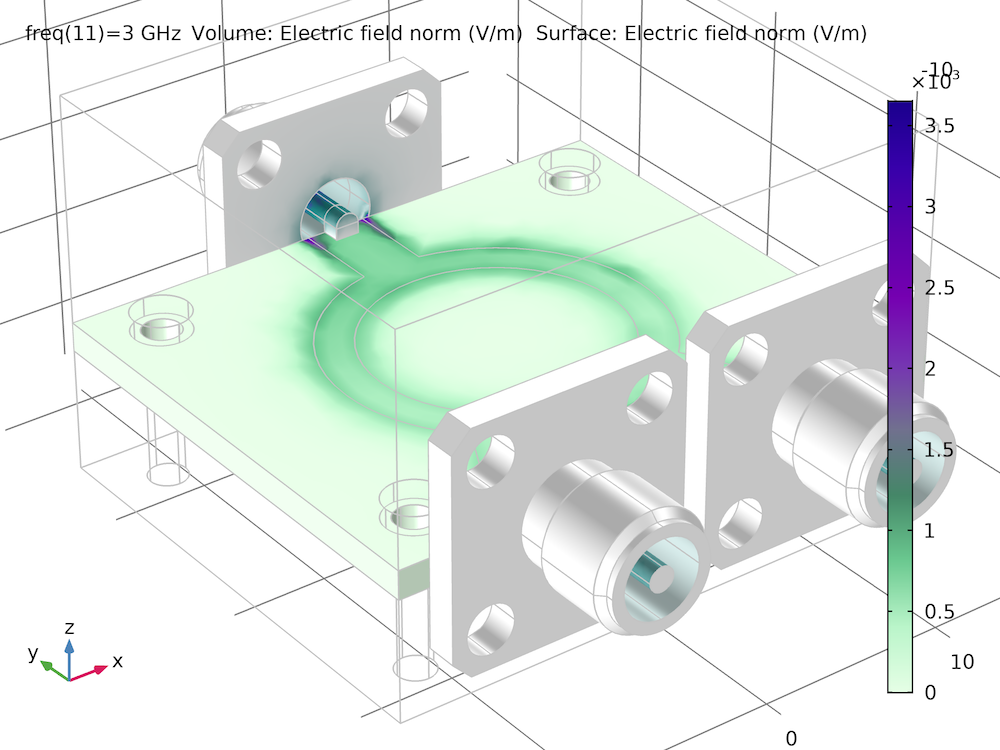
The electric field norm shows that the input power is divided evenly across the two output ports.
In the graph below, the S-parameters are plotted showing the frequency response curve of the divider. There is a very good input matching at 3 GHz and input power is evenly divided at the two output ports, demonstrating that there is no resistive loss during the power split. The graph shows the typical frequency response that is expected from all three-port Wilkinson power dividers.
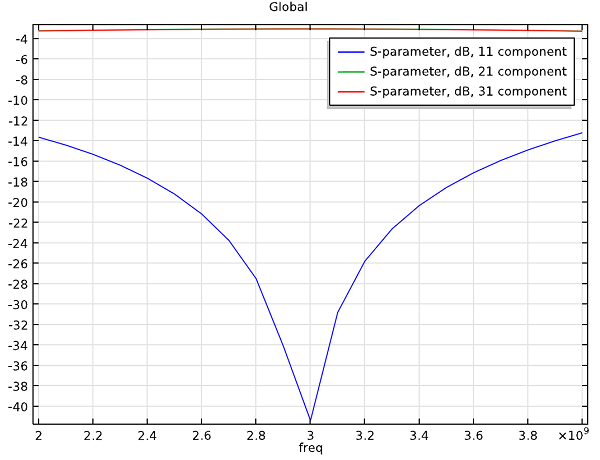
The S-parameters show the frequency response curve of the divider, demonstrating that the coupled power at each output port is about -3 dB and around 3 GHz.





Comments (1)
Suidong Yang
October 15, 2013The simulated S21, S31 look too flat over the claimed frequency band. better to list a table to show some edge effects.