

The most frequent question we get regarding the Fatigue Module is “Which fatigue model should I use in my simulations?” There is no straight answer to this question, since fatigue is not based on an exact differential equation, but on engineering observations that lead to different physical models. The applicability of each model can depend on factors such as material and loading type. Today, I will discuss different approaches for fatigue model selection and the applicability of the different models.
Identifying the Fatigue Behavior
A fatigue model can be selected in different ways. Expert knowledge is a good starting point. It may so be that, within your organization, there is prior knowledge on the topic if a similar application has been analyzed already. Alternatively, you may also find expert knowledge through a literature search. Since about 90% of all structural failures are caused by fatigue, there is a great chance that another engineering team has already analyzed a similar application to yours.
When there is no prior knowledge on the fatigue case, a suitable fatigue model can be proposed based on a few questions regarding loading conditions and expected fatigue failure. In the diagram below, I have summarized the key questions you should ask when evaluating fatigue using the Fatigue Module.
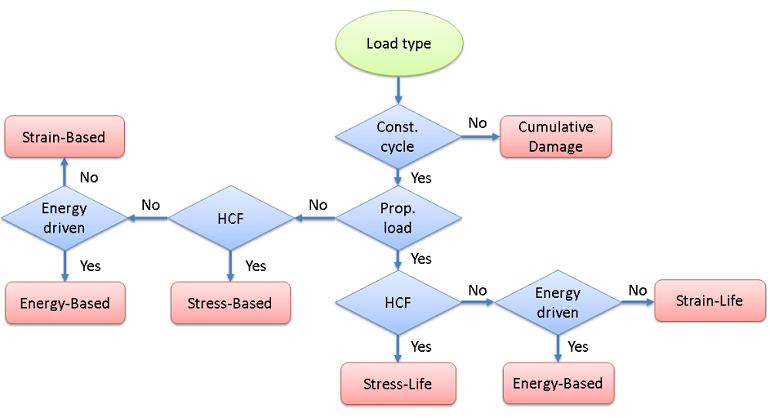
Selection of the fatigue model type.
Random Load Fatigue
First, you need to determine whether the external load is random or if your application is subjected to a constant cycle. A load that is not truly random, but has sequences of non-constant load cycles, could also fall into this category.
The stress history for random loads introduces a complex load scenario in the structure that requires an advanced evaluation technique to quantify the stress response. If your application is subjected to random loading, you can evaluate fatigue using the Cumulative Damage feature, where the random load is converted into a stress range distribution, rather than the single constant stress cycle — which is assumed for the other evaluation techniques.
You can find more details about this computation method in my previous blog post “Random Load Fatigue“.
Proportional or Non-Proportional Loading
At constant load cycles, the structure is affected by a repeatable load sequence. In this case, you need to determine whether the loading is proportional or non-proportional.
In proportional loading, the orientation of the principal stresses and strains does not change during the load cycle. Another way to discriminate between these two cases is to consider the characteristics of the external load. With one source of the external load, the structural response is defined by a stress tensor where all components change in phase. When the external load is applied in multiple points or if you have a traveling load, the components of the stress tensor can change out of phase. These two types of load cycles require different techniques for fatigue evaluation.
Proportional Loading
In proportional loading, the direction of the largest stress or strain that controls fatigue is clear. This was probably the type of application you worked with when you took your first class in fatigue. Back then, the load was always sinusoidal and classical methods such as the S-N curve, also called the Wöhler curve, were used.
In the Fatigue Module, the Stress-Life and Strain-Life models can evaluate fatigue at proportional loading. These models are based on a fatigue-life curve, which provides a direct relation between the fatigue life and the applied stress or strain amplitude.
One model in the Stress-Life family requires extra attention: The Approximate S-N curve (see figure below). In the model, you specify two points on the S-N curve. The first one is the transition between the high- and low-cycle fatigue, while the second defines the endurance limit. The advantage of this model is that it does not require any substantial knowledge of the fatigue material data, since the two required points can be related to the ultimate tensile strength. Although it is a rough approximation, it is a good starting point when you lack material data.
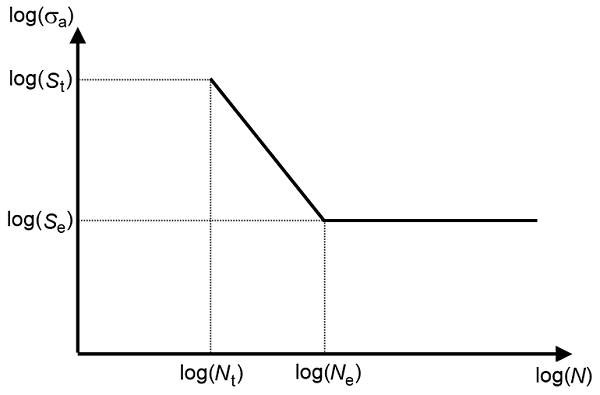
The approximate S-N curve model. The index t denotes the transition point, while the index e denotes the endurance limit point.
The Stress-Life models are suitable for simulating high-cycle fatigue, while the Strain-Life models are frequently used in the low-fatigue regime. The transition between the low- and high-cycle fatigue varies, but is usually somewhere in the span of 1,000 to 10,000 cycles.
Non-Proportional Loading
The challenge for non-proportional loading is to determine the range of the fatigue-controlling parameter. Since the direction of principal stresses and strains changes, so does the direction of the parameter that gives the highest impact on fatigue life.
In the Fatigue Module, this type of application can be assessed with the strain-based and stress-based models that I discussed in the blog entry “Fatigue Prediction Using Critical Plane Models“. These are called critical plane models because they evaluate many orientations in space in search for the critical plane where fatigue is expected to occur.
The strain-based models are suitable for fatigue prediction at low-cycle fatigue, while the stress-based models are frequently used to predict high-cycle fatigue. Most of the fatigue models predict the number of cycles until failure. The stress-based models predict a fatigue usage factor, which is the fraction between the applied stress and the stress limit. This indicates to the user whether the stress limit has been exceeded and failure is expected or if the component will hold for the expected fatigue life. You can view the fatigue usage factor as the inverse of a safety factor.
Fatigue Based on Energy
In some cases, the stress or strain alone is not sufficient to characterize the fatigue properties. You can then use the energy-based models. These combine the effect of stress and strain into energy, which is released or dissipated during a load cycle.
The energy-based models are frequently used in nonlinear materials in the low-cycle fatigue regime. Since the energy can be calculated in different ways, the energy-based models can be used in proportionally and non-proportionally loaded applications.
The blog post titled “Modeling Thermal Fatigue in Nonlinear Materials” demonstrates the use of the energy-based models.
Fatigue Model Examples
I would like to share a few examples to demonstrate how the different model types are used:
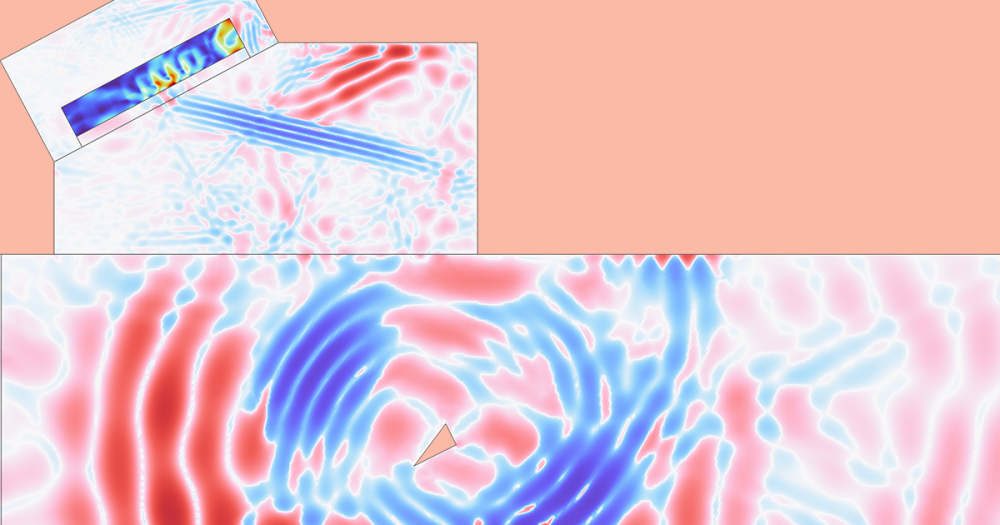
- In the example Random Load Fatigue in a Frame with a Cutout, the fatigue model takes into account a random load consisting of 1,000 load events.
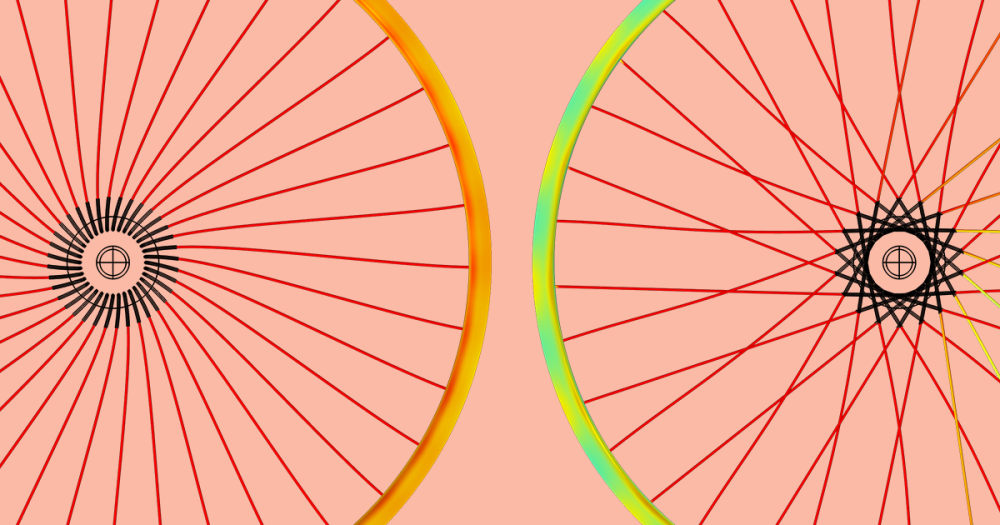
- The classical SN-curve is used in fatigue evaluation of a proportionally loaded bracket.
- In the example model High-Cycle Fatigue Analysis of a Cylindrical Test Specimen, fatigue is predicted in a non-proportionally loaded test specimen. The model also shows how to obtain material parameters from two types of fatigue tests.
- An energy-based fatigue criterion is used in the Thermal Fatigue of a Surface Mount Resistor model, where the dissipated energy in a viscoplastic solder joint eventually leads to failure.
If you have any questions about your fatigue modeling application, please contact us.


Comments (0)